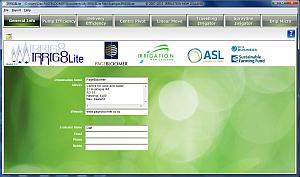
IRRIG8-Online is a series of online calculators covering different system types, which you can use right here. They were created for us by Page Bloomer Associates and are based on the 2005 Code of Practice. They calculate the measured applied depth and application uniformity, application rate and report other results. More factors are being added as time permits. There’s a special calculator to analyse pressure and energy.
Note: these calculators do not store any data, so your information is yours and yours alone.
When you close or refresh the calculator, your data is deleted (we see this as a feature, not a bug!).
Before you leave, make sure you download any reports, charts or results files you want!
Author Archives: Dan Bloomer
Well Within Nutrition Launches
 We are delighted that Well Within, a community and personal nutrition consultancy, is up and running. This complements our sustainable food production values and services to provide a full programme of services “from soil to gut”.
Well Within was established by Phillipa Page, Principal at Page Bloomer Associates. A qualified nutritionist (Dip Nutritional Science), Phillipa has a particular interest in helping people understand their own unique digestion, food needs, cultural values and habits to achieve best health.
Well Within operates from consulting rooms at the Centre for Land and Water at 21 Ruahapia Road, Hastings.
IRRIG8Lite Updated
The On-farm Irrigation System Calibration Tool, IRRIG8Lite was updated on 11 February 2014.
The key changes are in the Centre Pivot and Linear Move Irrigator calibration protocols. The only difference is that the Collector numbering has been reversed, so that Collector Number 1 is now the one closest to the machine inlet. In the case of Centre Pivots that is the closest to the pivot centre. For Linear Moves it is the collector nearest the tractor.
Minor changes include correcting a misnumbering in the Application Graphs.
The help files and Field Sheets have been updated to reflect these changes.
Download the latest version from http://www.pagebloomer.co.nz/resources/irrig8lite/
The assistance of ASL Software in processing these changes is gratefully acknowledged.

Managing Water a Whole Farm Project
This article first appeared in Irrigatin New Zealand’s Quarterly magazine in 2012.
Hew Dalrymple says mapping maize yields with his combine harvester highlighted problems with water in his paddocks: some parts had too much and some had too little. Hew and brother, Roger, now have 20 pivot irrigators at Waitatapia, their 2400ha Manawatu sand country farms. And a comprehensive drainage programme as well.
Soils at Waitatapia are low-lying, deep sands in flat to undulating contour. Crops often suffer yield loss due to drought stressed dune tops, a high water table and ponding in depressions.
An integrated irrigation and drainage programme is in train, using high-tech land-levelling and drainage, centre pivots and precision irrigation.
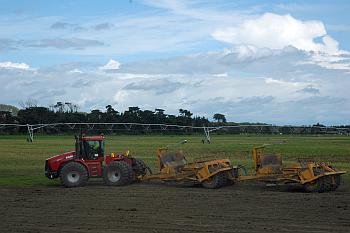
Land-levelling, or re-contouring, aims to even out the soil pattern and change the contours to gently rounded or more flattened slopes which follow the natural lie of the land. Elevation data collected on-farm with high accuracy GPS is fed into a software package that identifies best cut-and-fill options. A 560hp tractor and two large GPS controlled scrapers do the work. In effect, the tops are put in the hollows, and a median grade established.
The re-contouring is complemented by a surface drainage network, also installed with the help of GPS. “We need to be careful with open drains in sand, but it is a critical part of our infrastructure,” says Hew.
Water for irrigation comes from the Rangitikei River. Gravity helps deliver it to the and through the farm, greatly reducing energy costs. Pivots are the only realistic method given the soil type and scale of operation. But they do have limitations.
Several belts of pine forested sand dunes prevent pivots from completing full irrigation circles. In several places dunes have been removed to increase the arc and irrigated area.
Because some areas under the pivots still have wet spots or drains requiring no irrigation, Hew has invested in three variable rate systems.
Mapping with electromagnetic (EM) sensors and GPS logging helped identify variable soil zones. “We’ve got a clear picture of the lower wet spots and the higher dry spots, and they correspond to our yield maps.” Carolyn Hedley at Landcare Research turned the EM maps into soil water holding capacity maps. These were used to design and manage the VRI system.
The Dalrymples use a soil-moisture measurement service to help schedule irrigation. Light soils, variable weather, a high water table and capillary rise make careful scheduling essential. “We are also using EM survey information to select positions for soil moisture probes. That way, they will best represent the range of soil characteristics and drainage patterns,” says Hew.
So water management at Waitatapia is more than irrigation. Hew says, “It is about using water, nutrients and energy in better ways. Better soil water management equals better nutrient management. We invest a fair amount in irrigation. We don’t want to pay a big power bill to over-water and flush nutrients through the soil profile.”
“It is a big, expensive, integrated programme, but introducing irrigation and managing drainage has massive benefits for production and confidence,” says Hew. “The soils here are very light, but with good management they grow crops and pasture amazingly well.”
Excess Water Factor
The IRRIG8Quick Irrigation Calibration worksheets calculate a number called the Excess Water Fraction. A couple of recent queries have asked for more explanation, so here it is.
The Excess Water Factor uses Applied Depth and Distribution Uniformity (DU) to determine how much extra water is required to adequately water the area. This is compared to a perfect system (DU=1).
IRRIG8Quick uses DUlq, which is based on how much water the lowest quarter of the irrigated area receives compared to the average across the whole area. DUlq was (I think) introduced in the 1950s by the US Soil Conservation Service.
DUlq can be used to determine the Scheduling coefficient, or how much extra water should be applied to adequately irrigate most of the area. The Scheduling coefficient is just the reciprocal (1/DUlq). Alternatively, divide your target application depth by your system’s DUlq and apply that much irrigation.
Let’s say you aim to apply 20mm of irrigation. If your system has a DUlq of 0.80, then pump to apply 25mm (20 / 0.80 = 25). This way, 7/8th of the area will get at least the targeted 20mm. Some will get quite a bit more and some will get a wee bit less. But it is a good trade-off between getting enough watered and not wasting too much.
This explains why getting uniform application is so important. A system with a DUlq of 0.80 uses 25% extra water. A system with a DUlq of 0.50 would need 100% extra water.
That is what the Excess Water Fraction is working out.
The formula ((Depth ÷ DU) – Depth) ÷ Depth x 100 firstly calculates the total water that must be applied (depth / DU gives total depth needed). That minus depth gives the extra depth needed. That divided by the depth gives the percentage extra water needed.
An example.
- 20mm average depth
- DUlq 0.80
Solution
- 20 / 0.80 = 25 (average depth / DUlq)
- 25 – 20 = 5 (Total – average depth)
- 5 / 20 = 0.25 (Extra / average depth)
- 0.25 x 100 = 25% (convert to percentage)
You can use this to approximate how much extra money you spend on power and water (if you pay for it). It also shows how much water you could use elsewhere if the system was perfect.
You could also calculate the EWF for a very good system (say DU = 0.9 for a pivot), and compare how much extra water you are using compared to that ideal system.
Protocols for Compliance Checks of Farm Dairy Effluent Irrigators
I spent a day with staff from a regional council discussing farm dairy effluent application. In particular, they were interested in protocols for monitoring the performance of travelling irrigators. They need efficient and acceptable ways to monitor compliance with regional plan rules and resource consent conditions.
It is an interesting topic.

For the purpose of effluent application, the regional council has defined high and low risk soils, and different consent conditions apply. And of course, there are variations on conditions depending on when consents were issued, the location of the site and so on. And some consent conditions apply to nutrient loadings, including both 24 hour and annual time frames. Yet others relate to soil moisture status, and others to applied depths.
We discussed a lot of things:
- soil water physics; including application depths, rates, and uniformity
- surface ponding and over-land flow or run-off
- the Farm Dairy Effluent System Design Code of Practice and Design Standards,
- the Irrigation Evaluation Code of Practice,
- current approaches for assessing dairy effluent irrigators
- results from system evaluations
- accuracy and confidence of monitoring results
Then we went out to a farm and physically measured travelling effluent irrigator performance. And we debriefed.
And so to a protocol: what elements are required?
A protocol needs to be:
- recognised – look for existing procedures and processes that are suitable
- defensible – ensure sufficient sampling and fair statistics
- cost-effective – be efficient, not overly time consuming
- meaningful – so everyone can understand the process and the outcomes
Most, if not all, of these are available. The Irrigation Evaluation Code of Practice and the Farm Dairy Effluent System Design Code of Practice and Design Standards, cover field sampling, statistics and standards reasonably well.
But they were not developed as tools to audit performance of Farm Dairy Effluent irrigation performance (equipment and management) against the full range of regional plan rules and individual resource consent conditions that are found within one region, let alone across the country.
And as a country, we still have not agreed on how to assess surface ponding, or interpret our findings. What is acceptable in what environments, and over what time frames?
Dairy Effluent
We have just completed a series of presentations with DairyNZ, presenting the new Farm Dairy Effluent Design Code of Practice and Standards to industry people.
Workshops were presented in Hamilton, Rotorua, Palmerston North, Ashburton, Invercargill and Whangarei. Others are to follow.
This is only one part of a comprehensive programme that Dairy New Zealand and milk companies have underway. There are initiatives to upskill system providers, farmers and operators through workshops, field days and formal training.
The Code and Standards were developed over the last couple of years in conjunction with Aqualinc Research, DairyNZ, Fonterra, MPTA and IrrigationNZ. The documents (and more) are available on the DairyNZ website. Click here>to go to the Effluent Code page.
Development of the Code and Standards was stimulated by an Environment Waikato initiative to raise the standard of efffluent systems. Development was overseen by a steering group and technical advisory group.
Steering Group
- AgVice
- Effluent and Irrigation Design
- Environment Waikato
- Federated Farmers
- Farming Supplies New Zealand
- Fonterra
- Hi-Tech Enviro Solutions
- Irrigation NZ
- New Zealand Milk Pumping and Trades Association
- Numedic
- Page Bloomer Associates
- RX Plastics
- Stuart Reid
Technical Advisory Group
- AgResearch
- Aqualinc Research
- DairyNZ effluent specialists
- Fonterra
- Hi-Tech Enviro Solutions
- Page Bloomer Associates
Any comments can be posted here, or directed to DairyNZ
Pivot Evaluation Protocol Amended
The standard irrigation system evaluation protocol for Centre Pivot irrigators has been amended. The main change is the removal of the Circular Uniformity test.
The updated protocol can be downloaded from: http://www.pagebloomer.co.nz/wp-content/uploads/2010/04/COP%204-7%20Centre%20Pivot.pdf
The Circular Uniformity test was adopted on recommendation from the Irrigation Association publication, “Center Pivot Design” 2000, pp179 – 181.
Our experience found the test to be problematic; much variability noted during such tests has been due to the radial variation (differences as you move along the length of the machine) rather than elevation difference or hysteresis effects.
The Evaluation Code Centre Pivot Evaluation protocol retains the Radial Uniformity test, and recommends multiple radial tests with and without any end gun, corner arm or other major variable operating. Repeating radial tests in up-slope and down-slope positions would also appear more useful than a circular uniformity test.
The most common failings we have identified to date are associated with incorrect nozzle selection and or insufficient system pressure.
Nozzle package selection should provide a machine with high performance. Unfortunately, too often this is not the case. The ‘blame’ is usually identifiable and there is no one answer.
In some cases, system purchasers (farmers) provide water / well flow rate information that is optimistic. Perhaps the information originates with well drillers, perhaps it is simple misunderstanding or forgetfulness. Regardless, once built and the true flow measured, it becomes obvious that the possible flow will never match the demand of the nozzle package supplied.
In other cases the specifications for the machine length have changed but the nozzle selection not redone. And in a couple, the package was just wrong!
Low (unsatisfactory) end pressure is also relatively common. Often there is insufficient flow available to fill the system, as noted above. Other times we find incorrect settings in variable speed drive controllers. It is good to set systems to minimise energy consumption, but excessively low pressure is false economy. Make sure the pumps are working to design specs so the system does the job for which you bought it.
We like to see a pressure test point or pressure gauge mounted above the regulator on the last dropper on the main machine. If the pressure there is less than 40kPa higher than the regulator setting, we expect to find low performance.
Excessive surface ponding
I’ve worked a lot and with many people on irrigation efficiency and on application of effluent to land. We keep coming up against the question, “What actually constitutes surface ponding?”
I’d love to get some agreement on this.
In the last year or so:
- I’ve heard that ponding only applies to durations lasting 4 hours or more, and I’ve heard it applies to anything from a few minutes duration.
- I’ve heard it has to be at least a pretty big area and I’ve heard anything at all counts.
- I’ve been told the Environment Court determined any duration mattered. A regional council had applied a four hour minimum when assessing ponding, but the court said the consent said ‘no surface ponding’ and that meant no surface ponding.
- I’ve seen lots of it and I’ve seen evidence that excessive application rates are problematic – both for irrigation and for land applied effluent.
There will almost always be some surface ponding; even drip systems micro-pond. So applying a concept of excessive surface ponding seems better. But what is excessive surface ponding?
Excessive surface ponding – defined
In the interests of sparking debate, I propose a definition of excessive surface ponding:
“Excessive surface ponding means the presence of surface water pooled in contiguous areas of greater than 0.04m2 found, one hour after application starts, at more than four of forty sample points selected at random over at least 25% of the application area, with each point being more than two metres apart.”
- Surface water pooled may need definition, but I’d say means clearly visible puddling – i.e. not just wet soil
- contiguous areas means connected
- 0.04m2 (about 20x20cm) is bigger than a hoof print (my first intent) but is maybe too small – the auction starts now, your bids please . . . .
- one hour after the start of application covers both travellers and stationary nozzles but is the time right?
- Four of forty sample points means 10% and hopefully is a big enough sample that is not too onerous to take
- Random is random – let’s specify a method e.g. tossing a 0.25 m2 quadrat or ring backwards over your head with your eyes shut having spun twice clockwise
- 25% of the application area means you have to look around a bit
- More than 2 m apart spreads it out a bit and avoids sampling landing in the same contiguous, but relatively small, pond. Pick a number (and justify it!)
I don’t know that I agree with my proposed definition.
For a start, I’ve watched high application rate water (and effluent too) disappear very rapidly, and upon digging significant holes, couldn’t find sign of it in the rootzone. So maybe, if you can’t see ponding for more than 10 minutes, that’s when you should get worried!?
Please, have a think, then post a comment below. Let’s try to have a reasoned and enlightening debate!
Regards
Dan
Measure Irrigation Energy Efficiency
IRRIG8Quick Irrigation Energy Efficiency guidelines and worksheets have been loaded on the Page Bloomer website: See http://www.pagebloomer.co.nz/resources/tools/irrigation-energy-efficiency/
These guidelines and worksheets were funded by the Energy Efficiency and Conservation Authority, EECA.
There are two separate guidelines, one for the pumping plant (pump and motor) and one for the delivery system (headworks and mainline). Ideally you’ll do both – they are designed to work together.
Why check pump performance?
Profitability – Incorrectly sized or physically deteriorated pumps will waste energy and money. A good pumping system saves money!
Sustainability – efficient pumping minimises energy use and carbon emissions. A good pumping system saves the environment!
Pump and motor selection are important system design considerations. Incorrectly sized pumps and/or motors will not operate at their most efficient points. So they will waste energy.
Low pressure is a common cause of poor irrigation uniformity which reduces overall system effectiveness and efficiency. The pump must provide adequate pressure and flow to ensure the system operates as designed.
Excessive pressure affects performance and wastes energy. Pump selection will usually allow about 5% extra pressure capacity to allow for slippage with time. But excessively oversized pumps are major energy wasters.
Why check delivery system performance?
Profitability – Incorrectly sized or physically deteriorated components can waste energy and money. A good system saves money!
Sustainability – energy efficient irrigation minimises energy use and carbon emissions. A good system saves the environment!
Pipe and component selection are important system design considerations. Selecting smaller options may reduce up front capital cost, but increases ongoing energy costs as bigger pumps are required. The correct selections optimise the necessary trade-offs.